Free portfolio project
E-commerce Sales & Delivery Analytics
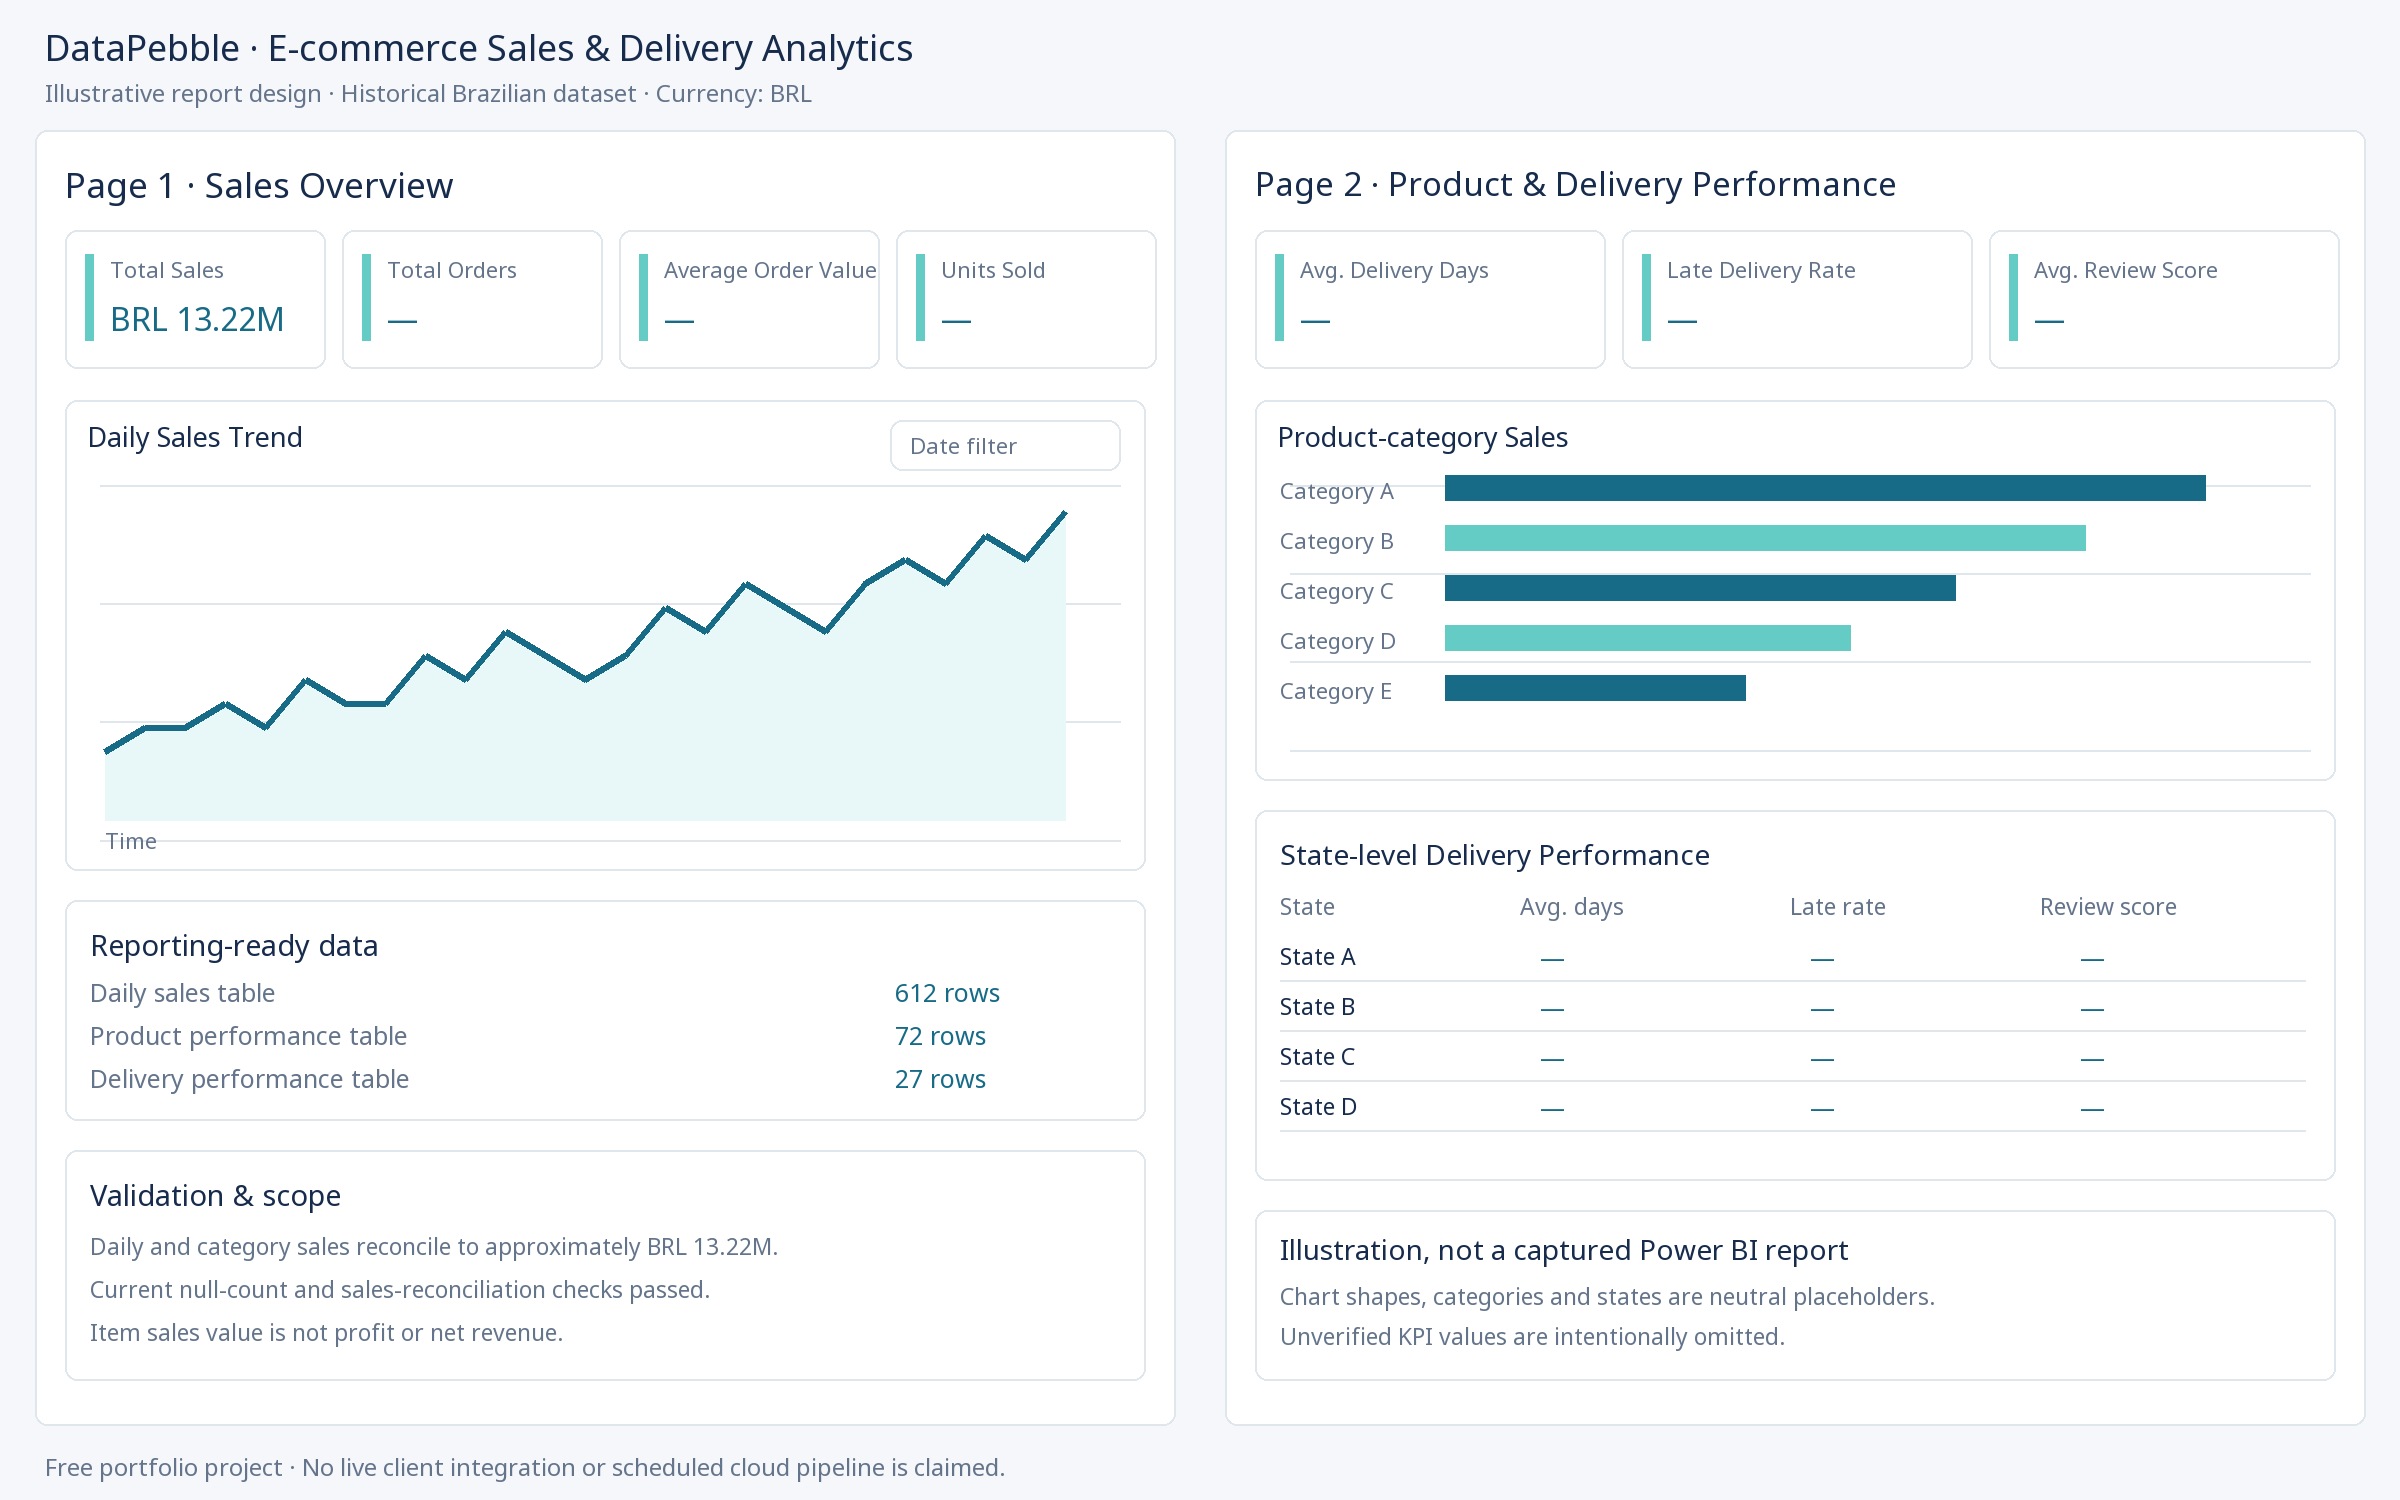
Brazilian e-commerce data analyzed with Python, SQL, and Power BI.
- Public CSVs
- Python ETL
- Validation
- SQLite
- Power BI
PythonpandasSQLitePower BIDAX
Data integration • Reporting automation • Power BI dashboards
DataPebble helps businesses connect their data sources, automate reporting workflows, and turn scattered data into clear, actionable Power BI dashboards.
Clean reporting tables
The problem
Business data is spread across multiple platforms and spreadsheets.
Teams manually combine and clean data before reporting.
Reports take too much effort to update, check, and share.
DataPebble can help connect the relevant sources, automate agreed transformations, and give you a more reliable, repeatable reporting process — so less time goes into preparing numbers and more into using them.
Services
Bring data from agreed e-commerce platforms, files, and business systems into a consistent reporting workflow.
Learn more →2.Clean, validate, combine, and transform data into reporting-ready tables.
Learn more →3.Build dashboards that help business owners understand sales, orders, products, and operational performance.
Learn more →4.Reduce recurring manual reporting work through scheduled processing and refresh workflows where technically supported.
Learn more →5.Add appropriate logs, failure notifications, and retry handling according to the project scope.
Learn more →How it works
Understand the business, data sources, reporting needs, and existing setup.
Agree on how data will be accessed and integrated.
Develop the transformations, reporting tables, and dashboard.
Check the agreed outputs, document the workflow, and hand over the deliverables.
Free Portfolio Projects
Free portfolio project
Brazilian e-commerce data analyzed with Python, SQL, and Power BI.
Free portfolio project · Completed
A completed project helping small supermarkets understand sales and plan inventory.

Packages
$469one-time, starting price
Suitable for a small, clearly defined reporting requirement.
$1,249one-time, starting price
Suitable for a business needing a more automated reporting workflow.
$2,929one-time, starting price
Suitable for a broader, more involved reporting requirement.
Tell us about your data sources, reporting challenges, and business goals. We’ll discuss whether DataPebble is a good fit for your needs.